Music in numbers
IMPALA
- IMPALA represents over 6000 independent music companies and national associations across 33 countries in Europe.
IMPALA Sales Awards represent over 150 million albums sold and €2 billion in revenue.
The independents
- The music sector consists of thousands of independents and 3 multinationals – “the majors”.
- 99% of music businesses are micro, small or medium sized enterprises – “the independents”.
The independents are the innovators and early adopters, discovering new talent and producing 80% of all new releases. The independents also account for 80% of the sector’s jobs.
European music
Source: IFPI/ Oxford Economics
European cultural & creative sectors account for 4,4% of EU GDP and 7.6 million full-time jobs.
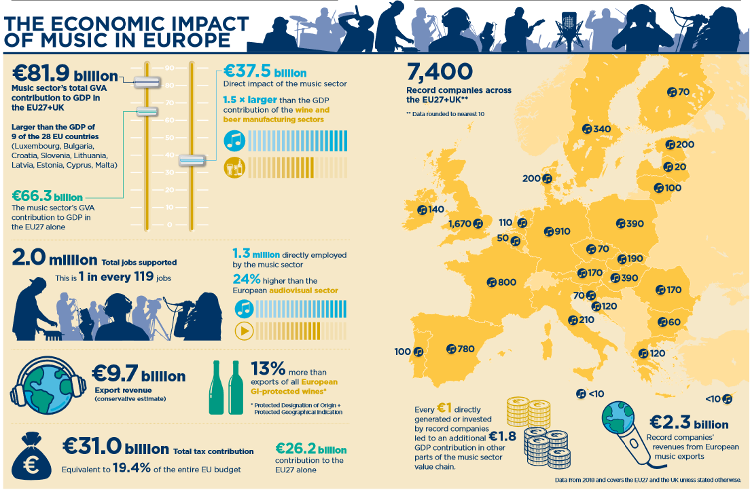
The European music sector specifically is supporting 2 million jobs, contributing €81.9 billion in gross value added to GDP, and exporting €9.7 billion worth of goods and services to countries outside the EU27 and UK.
Europe generates nearly a third of total recorded music revenues worldwide and represents the second largest region in the world for recorded music revenues, growing by 8.3% in 2024.
- In 2023:
- The EU 27’s recorded music revenues grew by 8.7% to a total of €5.2bn.
- Streaming revenue in Europe as a whole grew by 10.9% to reach $5.1bn, representing 63.9% of the total European recorded music market. This is the first time that this format is crossing the $5bn mark in the region.
- Paid subscription streaming represented the majority of that with $4,1bn. Europe has 146 million subscription account users, representing 21.9% of the global total.
- Ad supported audio streaming reached $530m, exceeding $500m for the first time.
- Ad-supported video streaming revenues reached $507.m, their highest level ever, also surpassing $500m for the first time
- Performing rights revenues increased by 6.3% to a total of $1.5bn in 2023 – 18.8% of total European revenues. Europe continued to be a major player in performance rights revenues, accounting for over 54% of the world’s performance rights income in 2023.
- In Europe, physical revenues grew by 6.6% to amount to $1.17bn, but far from the global growth rate of 13.4%. Vinyl however, continued to show double-digit growth with a 14.8% growth in 2023.
Synchronisation rights revenues slightly declined (-4.4%) to reach $129m in 2023.
Music industry
- In 2024, global recorded music revenues totalled US$29.6 billion. An increase of 4.8% compared to 2023 ($28.6bn).
- The music industry’s digital revenues (including streaming) now represent 71.8% of total revenues (2024).
- Streaming continues to grow in popularity across the globe – exceeding $20.0bn for the first time.
- Streaming revenues specifically grew by 7.3% (year-on-year) to represent 69.0% of the total market (2024) – $20.4bn.
- Subscription streaming revenues accounted for over 50% of global recorded music revenues in 2024 and was the key driver of growth, with an increase of 9.5% ($15.3bn), whilst ad-supported streaming formats (combined) grew by a more modest 1.2% ($3.2bn).
- Streaming aside however, digital revenues saw a drop of 2.6% in 2023, accounting for $908m. This was, however, the format’s smallest decline since 2013.
- Synchronisation revenues increased by 6.4% and grew for a fourth successive year in 2024, accounting for $650m. Representing 2.2% of total revenues.
- Performance rights revenues in 2024 grew by 5.9% to a total of $2.9bn, representing 9.7% of total revenues.
- Global physical revenues amounted to $4.8bn and declined by 3.1% in 2024. This decline however was set against a very strong performance for the format in 2023, when revenues increased by 14.5%. CD and music video revenues fell by 6.1% and 15.5% respectively in 2024. Vinyl revenues grew by 4.6%, experiencing their 18th consecutive year of growth.
- 55 out of 58 markets recorded growth in 2024, which included eight of the top 10 global markets.
In 2023, record companies invested $7.1 bn in discovering and nurturing new artists ($3.9 bn in A&R/ $3.2 bn in marketing) while labels’ payments to artists having increased by 96%.
Further statistics
- WIN global market share analysis of the independent music sector: download key statistics and the latest full annual report 2023/2024.
- The Economic Impact of Music in Europe is available – IFPI/Oxford Economics: click here
- IFPI Engaging with Music 2023 Report: click here
